Substantiating Crunch Claims: How to Measure Crispness and Crunchiness
The sensory and commercial power of 'crunch'
In the snack, bakery, and fresh produce sectors, textural perception is just as vital to consumer acceptance as flavor. Consumers immediately associate the sound and feel of a crisp chip, cereal, or cracker with product freshness and premium quality. Consequently, global food manufacturers increasingly leverage ‘crunch’ as a primary marketing driver. However, packaging statements like “extra crispy” or “50% more crunch” cannot rely on subjective impressions. Substantiating these claims requires empirical, quantitative measurement within the laboratory.
Differentiating crispness from crunchiness
While often used interchangeably, crispness and crunchiness represent distinct mechanical and sensory behaviors. Crispness is characteristic of thin, brittle structures (such as potato chips or thin wafers) that fracture quickly, generating a high frequency of small force peaks. Crunchiness applies to denser or thicker samples (such as nuts, carrots, or toasted bread) that offer higher initial resistance. The resulting force profile displays larger, lower-frequency peaks with wider force drops between fractures.
The 4th dimension: Synchronized force and acoustic data (RAED)
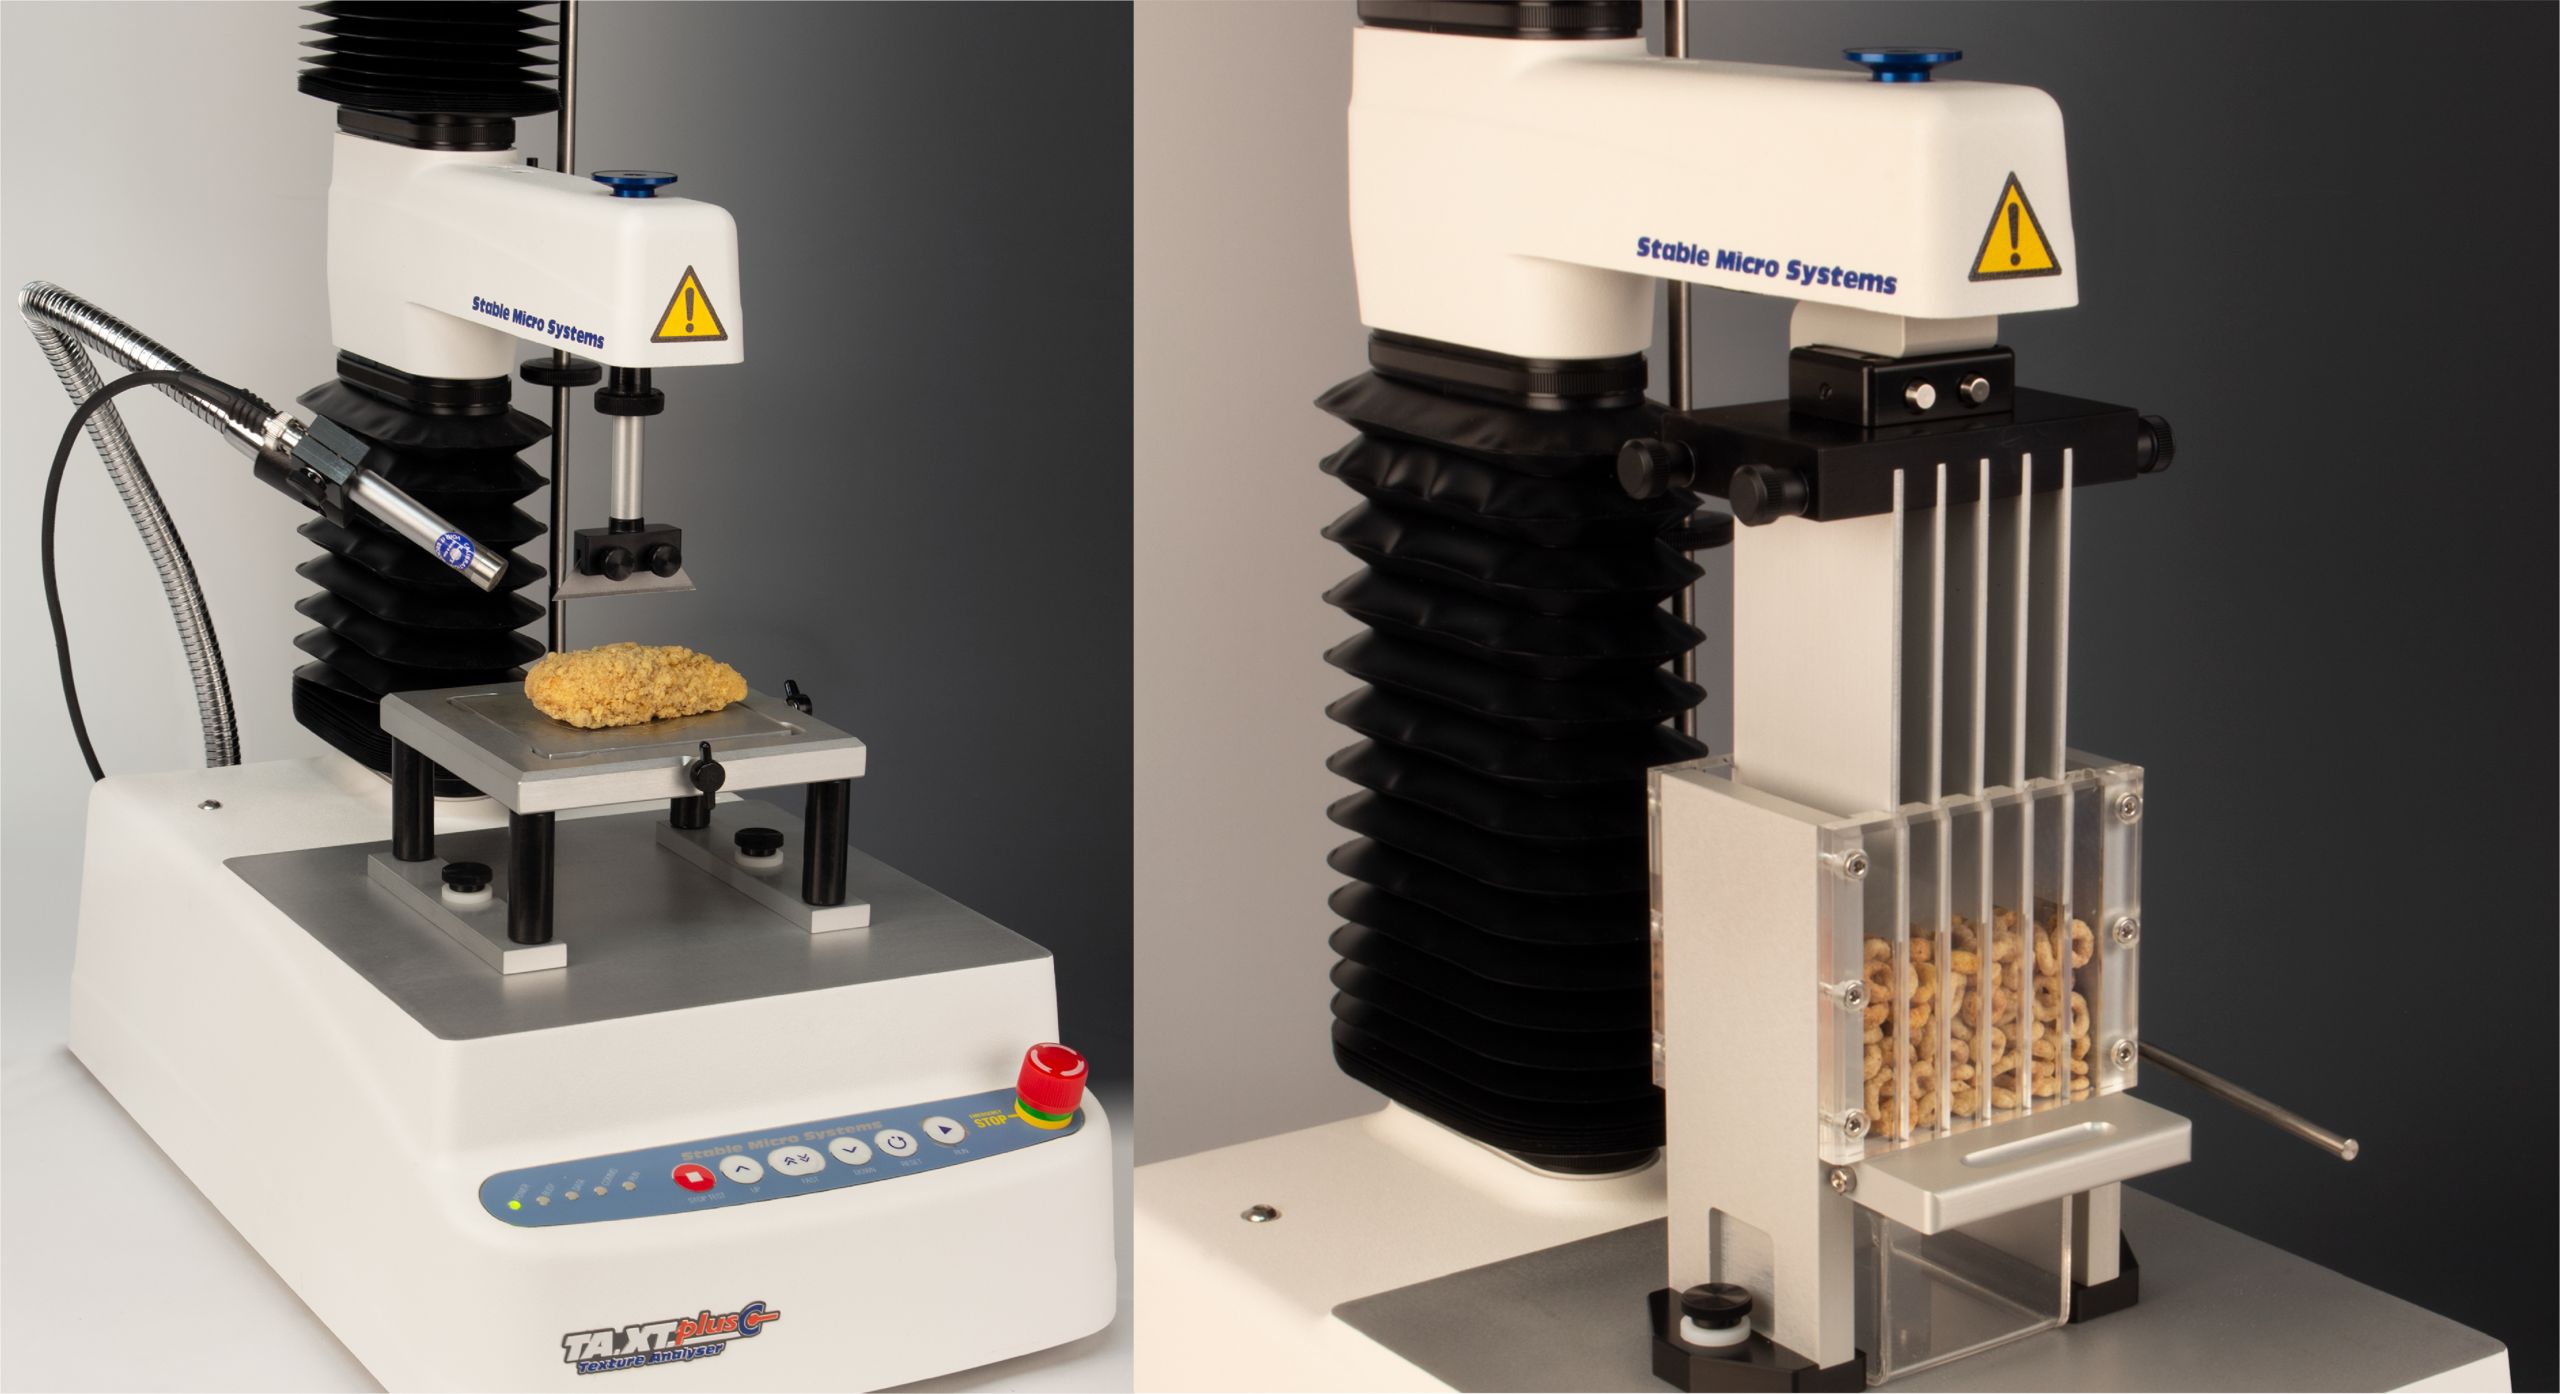
During testing, a Texture Analyser captures mechanical resistance data at acquisition rates of up to 2,000 points per second. Because crunchiness is inherently auditory, the ReferenceAcoustic Envelope Detector (RAED) system introduces a fourth dimension by pairing mechanical force measurements with advanced sound detection. As the sample fractures, the system captures decibel levels and acoustic peaks simultaneously. Exponent Connect software syncs these acoustic signals as .wav audio files, allowing researchers to visually analyze acoustic energy while playing back precise audio events alongside the force curve.
Critical applications for R&D and Quality Control
Quantifying acoustic energy and force peak density provides R&D and Quality Control teams with actionable formulation data. When adjusting recipes — such as reducing fat or sugar content, introducing alternative flours, or applying moisture barriers — structural integrity changes dramatically. Acoustic texture analysis allows developers to establish exact moisture thresholds before crispness deteriorates, validate packaging protection, and engineer the optimal acoustic signature for their brand.
Ready to scientifically substantiate your product's crunch?
Looking to back up your textural marketing claims with repeatable, scientific data? The Stable Micro Systems Texture Analyser equipped with Acoustic Envelope Detection delivers the precise analytical capabilities your facility needs. Contact the Fysica Benelux team for tailored guidance or an in-lab demonstration.